
Sonar sludge survey for stabilization ponds and lagoons.
We map the sludge blanket across your entire pond and tell you how much is down there, where it is, and whether your treatment is bringing it down.
A boat, a sonar, and a map of what you cannot see
The sludge in a pond builds up out of sight, and a few spot readings with a sludge judge never tell the whole story. The survey replaces that with a complete picture.
1: Launch the boat
A remote-control boat goes onto the pond carrying a GPS-linked sonar, so people stay off the water for most of the survey.
2: Run the grid
The boat tracks the pond while the sonar reads the depth to the top of the sludge layer along the way.
3: Build the map
GPS position and sonar depth combine into a contour map of the sludge across the whole pond, plus a calculated volume.
4: We build the program around what the survey found
5: Track the trend
Repeat the survey and compare. The change in volume is the accumulation or reduction rate over time.
336,528 sonar data points on one 5.4-acre pond survey. Mapleton, North Dakota, April 2026.
What a survey turns into
- Belgrade, MN. Primary pond sludge went from 20 inches to 5 inches in two years, a 75 percent reduction, adding 66 days of retention and 21
percent more pond capacity. - Sebeka, MN. Seven feet of sludge was blocking a piping repair. After three months on an aggressive program it was down about four feet, and
the city completed the repair without land applying solids offsite.
The same pond, two years apart
Pelican Rapids, Minnesota, surveyed in May 2024 and again in April 2026. Sludge volume came down 32.18 percent over that period, recovering 1,780,000 gallons of storage. Same pond, same survey method, two years apart.
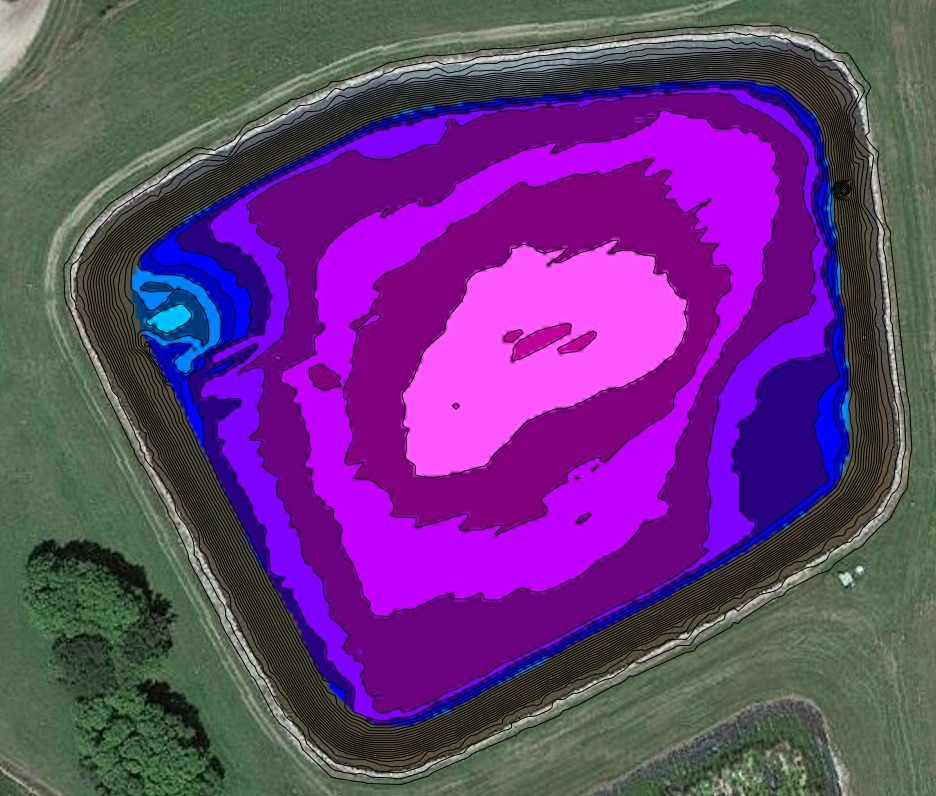
May 2024
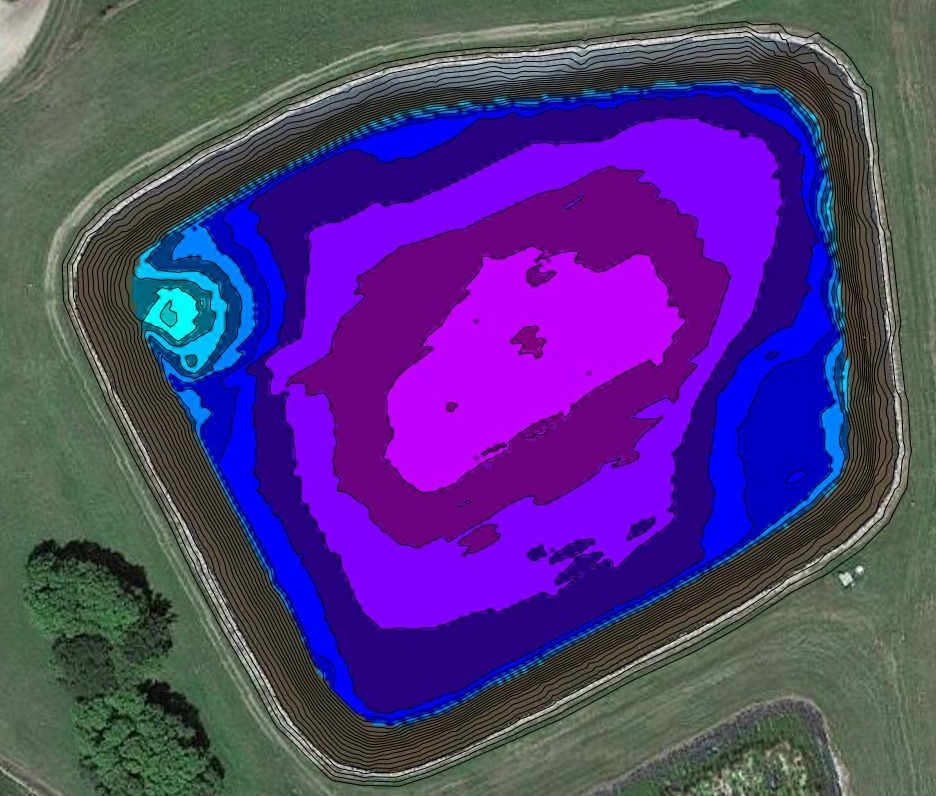
April 2026
Base imagery © 2022 Google. Sludge contours from Team Lab survey reports.
Sludge judge versus Sonar survey
Manual sludge judge
- A person takes a boat onto a sewage lagoon, which is slow and unsafe.
- Readings at a handful of points, so most of the pond is a guess.
- A calculated sludge volume you can trend across surveys.
- No real map, just a few numbers on a clipboard.
Sonar survey
- Remote-control boat keeps people off the water for most of the survey.
- Thousands of readings build a full-pond contour map.
- A calculated sludge volume you can trend across surveys.
- Data that drops straight into a desludging request for quote.
Monitor whether the program is working
A bioaugmentation program is designed to digest sludge faster than it accumulates. The only way to know is to measure. A survey before treatment sets the baseline, and a follow-up after 3-5 years shows whether the volume actually came down. That turns the program from a promise into a number, and it tells you when a pond genuinely needs dredging instead of guessing.
What people ask before they call
Do you have to drain the pond or shut anything down?
No, you don’t have to drain the pond. It needs to be at a minimum 3′ to accurately survey. However, if aeration is present in the pond, it will need to be shut off for 12-24 hours prior to the survey, allowing the sludge to settle.
How accurate is sonar compared to a sludge judge?
Sonar sludge judging is one of the most accurate methods in determining sludge volume, recording 20 data points per second and covering the entirety of the lagoon.
How often should we survey?
A baseline before treatment and a follow-up after 3-5 years is the usual pattern. Surveys track sludge reduction to determine cost savings and performance results.
Can the volume be used to determine sludge removal options?
Yes. The measured sludge volume and map give an operator what they need to quote sludge removal options.
Want to know what is really in your pond?
Request a sonar sludge survey and we will set the baseline.